

Part 2: Building Your First Causal DAG
From Domain Knowledge to Graph Structure
Senior Software Engineer with a knack for Python, Golang, TypeScript, and Elixir. I am also a bit of a Rust enthusiast. I am excited by all things scalability and microservices. Join me on this journey to becoming a unicorn 10x Engineer.
In Part 1, you learned why causality matters. Correlation tells you what happens, but causation tells you why and what to do about it.
Today, we're building your first causal Directed Acyclic Graph (DAG)—the foundation of causal reasoning.
By the end of this article, you'll:
Understand what DAGs are and why they're powerful
Build a complete causal model for plant disease detection
Learn to identify confounders, mediators, and colliders
Know how to validate your causal assumptions
Have working code to implement your DAG in Python
No more theory. Let's build something real.
What you'll need:
Python 3.12+
Basic understanding of probability
Curiosity about how things actually work
Let's go.
What Is a Causal DAG?
Graphs as Causal Models
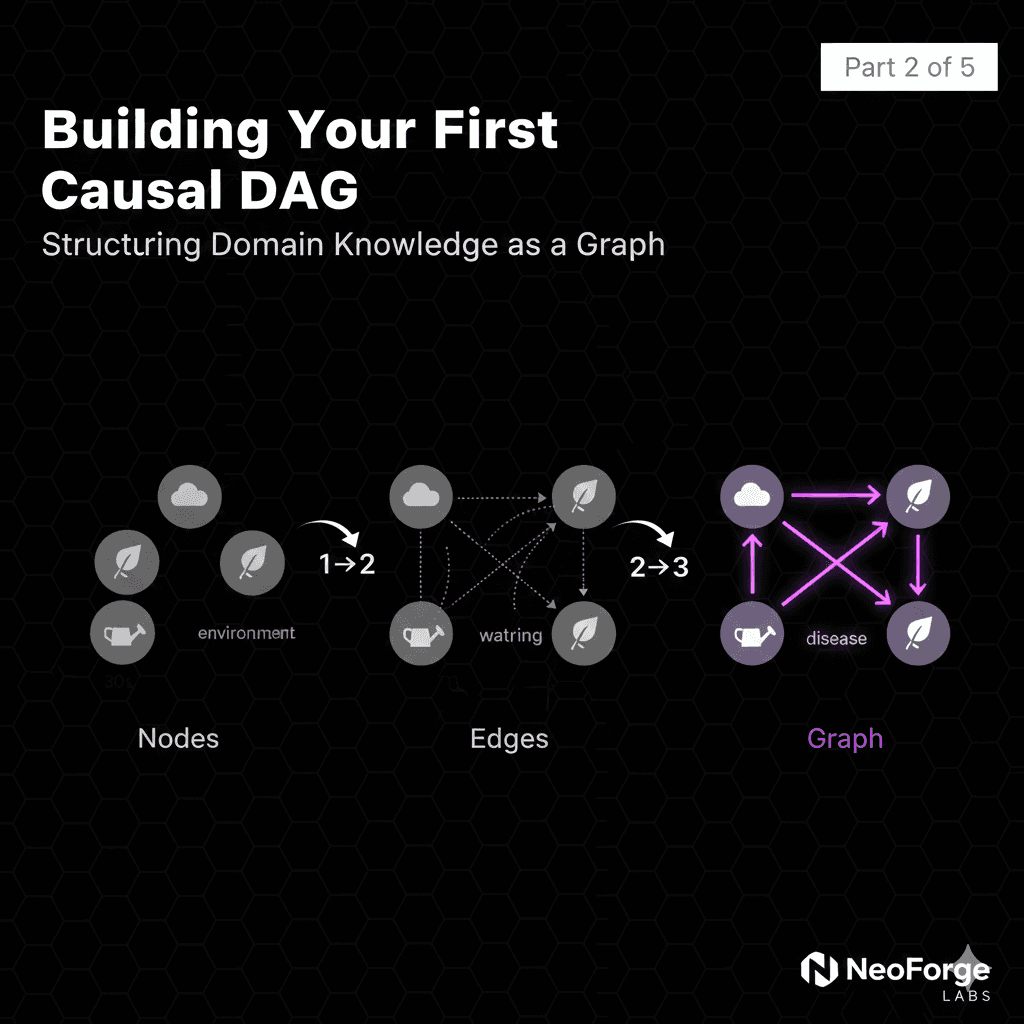
A Directed Acyclic Graph (DAG) is a visual representation of causal relationships:

Three key components:
1. Nodes (variables): Things that can change
Environmental temperature
Soil moisture
Plant health
Disease presence
2. Directed edges (arrows): Causal relationships
A → B means "A causes B"
Direction matters: Temperature → Disease ≠ Disease → Temperature
3. Acyclic (no loops): No circular causation
Can't have: A → B → C → A
Time flows forward, causes precede effects
Why Graphs?
Compact representation of causal knowledge:
Instead of writing:
If temperature is high AND humidity is high THEN moisture increases
If moisture is high AND air circulation is low THEN pathogen growth increases
If pathogen growth is high THEN disease risk increases
...
We draw:

DAG Knowledge Representation
The graph encodes:
Direct causes (arrows)
Indirect causes (paths)
Independence relationships (absence of arrows)
Causal mechanisms (structure)
Reading the Graph
From the DAG above, we can read:
Direct effects:
Temperature directly causes Moisture
Pathogen Growth directly causes Disease
Indirect effects:
Temperature indirectly affects Disease (via Moisture → Pathogen Growth)
Humidity indirectly affects Disease (via same path)
Independence (no arrow):
Temperature does NOT directly cause Disease
- It only affects it through the moisture mechanism
Air Circulation does NOT affect Moisture
- It only affects pathogen growth
This is powerful: The structure tells us what variables are related and HOW.
The DAG Answers Intervention Questions
Want to know: "What happens if I reduce humidity?"
Follow the arrows:
Humidity ↓
→ Moisture ↓
→ Pathogen Growth ↓
→ Disease ↓
The causal path tells us the effect of our intervention.
Want to know: "What happens if I increase temperature?"
Check the paths:
Temperature → Moisture ↑
Moisture → Pathogen Growth (depends on pathogen type!)
For fungi that need moisture: Growth ↓
For heat-loving pathogens: Growth ↑
The DAG shows us we need domain knowledge to complete the model.
What DAGs Cannot Do
Important limitations:
1. DAGs don't learn from data alone
You need domain knowledge to draw arrows
Data can validate or reject your DAG
But structure comes from understanding mechanisms
2. DAGs assume causality is stable
Same causes → same effects
Holds across contexts (mostly)
May break with extreme distribution shift
3. DAGs can be wrong
Missing arrows = missed confounders
Wrong direction = incorrect causal reasoning
Validation is crucial
But: A good DAG, grounded in domain expertise, is far more reliable than pure correlation.
Building the Plant Disease DAG
Step-by-Step: From Mechanism to Graph
Let's build our plant disease causal model systematically.
Step 1: Identify Root Causes (Exogenous Variables)
What are the fundamental inputs we can observe or control?
1. Environmental Stress
Temperature extremes
Humidity levels
Light availability
Composite measure of environmental conditions
2. Watering Practice
Frequency
Amount
Under/optimal/overwatered
Farmer-controlled variable
3. Plant Vigor
Overall plant health
Genetic factors
Age and maturity
Baseline resilience
These are exogenous (external) variables—they're not caused by other variables in our model.

Step 2: Identify the Causal Mechanism
Question: How do root causes lead to disease?
Domain knowledge from plant pathology:
1. High environmental stress + watering → Leaf Moisture
Hot weather increases evaporation
Watering increases surface water
Combined: creates conditions for pathogens
2. Leaf Moisture → Pathogen Growth
Fungi need moisture to germinate
Bacteria need water film to enter plant
Critical threshold: ~6-8 hours of leaf wetness
3. Pathogen Growth → Disease
Sufficient pathogen load → infection
Varies by plant immunity
4. Disease + Plant Vigor → Symptom Severity
Same disease manifests differently
Healthy plants show mild symptoms
Weak plants show severe symptoms
5. Symptom Severity → Observable Symptoms
What we actually see
Yellowing, spots, wilting, etc.
Step 3: Draw the Arrows
Now we connect the dots:

Node Legend:
Cyan: Exogenous (controllable or observable inputs)
Purple: Intermediate mechanisms
Pink: Latent (unobserved) variable
Step 4: Validate the Structure
For each arrow, ask: "Does X directly cause Y?"
| Arrow | Justification | Validated? |
| Environmental Stress → Leaf Moisture | Temperature/humidity affect surface water | ✅ |
| Watering → Leaf Moisture | Direct causal mechanism | ✅ |
| Leaf Moisture → Pathogen Growth | Pathogens need water | ✅ |
| Pathogen Growth → Disease | Sufficient load → infection | ✅ |
| Disease → Symptom Severity | Disease causes symptoms | ✅ |
| Plant Vigor → Symptom Severity | Vigor moderates expression | ✅ |
| Symptom Severity → Observable Symptoms | What we measure | ✅ |
Missing arrows (intentionally):
Environmental Stress → Disease?
- NO direct arrow: stress affects disease ONLY through moisture
Watering → Disease?
- NO direct arrow: watering affects disease ONLY through moisture
Plant Vigor → Disease?
- NO direct arrow: vigor affects symptom severity, not disease presence
This is important! The absence of arrows encodes causal assumptions.
Step 5: Name the Causal Roles
Understanding special node types:
Confounders:
Variables that affect both treatment and outcome
Example: If Environmental Stress affected both Watering AND Disease directly
Our model: No confounders (by design for simplicity)
Mediators:
Variables on the causal path
Example: Leaf Moisture mediates Environmental Stress → Disease
Pathogen Growth mediates Leaf Moisture → Disease
Colliders:
Variables caused by multiple parents
Example: Symptom Severity is a collider (caused by Disease AND Plant Vigor)
Special property: conditioning on colliders can create spurious associations!
Effect Modifiers:
Variables that change the magnitude of effects
Example: Plant Vigor modifies how Disease translates to Symptoms
High vigor → mild symptoms even with disease
Our Final DAG
7 nodes, 7 edges, complete causal story:
Root Causes → Mechanisms → Observable Outcomes
This is our working model. In Part 3, we'll use it for counterfactual reasoning. In Part 4, we'll design interventions.
But first, let's implement it in code.
Implementing the DAG in Python
Coding Your DAG with DoWhy
Let's make this concrete with Python code.
Install dependencies:
pip install dowhy pandas numpy networkx matplotlib
Define the DAG:
from dowhy import CausalModel
import pandas as pd
import numpy as np

# Define the causal graph
causal_graph = """
digraph {
    Environmental_Stress -> Leaf_Moisture;
    Watering_Practice -> Leaf_Moisture;
    Leaf_Moisture -> Pathogen_Growth;
    Pathogen_Growth -> Disease_Present;
    Disease_Present -> Symptom_Severity;
    Plant_Vigor -> Symptom_Severity;
    Symptom_Severity -> Observable_Symptoms;
}
"""

# Create sample data (we'll use synthetic for now)
np.random.seed(42)
n_samples = 1000

data = pd.DataFrame({
    'environmental_stress': np.random.beta(2, 5, n_samples),  # 0-1 scale
    'watering_practice': np.random.choice([0, 1, 2], n_samples),  # 0=under, 1=optimal, 2=over
    'plant_vigor': np.random.beta(8, 2, n_samples),  # Usually healthy
    'leaf_moisture_hours': np.zeros(n_samples),  # We'll compute
    'pathogen_growth': np.zeros(n_samples),
    'disease_present': np.zeros(n_samples),
    'symptom_severity': np.zeros(n_samples),
})

# Generate data according to causal structure
for i in range(n_samples):
    # Leaf moisture depends on environmental stress and watering
    base_moisture = 5.0  # baseline
    stress_effect = data.loc[i, 'environmental_stress'] * 10
    watering_effect = [-3, 0, 5][data.loc[i, 'watering_practice']]

    data.loc[i, 'leaf_moisture_hours'] = np.clip(
        base_moisture + stress_effect + watering_effect + np.random.normal(0, 1),
        0, 24
    )

    # Pathogen growth depends on leaf moisture
    moisture = data.loc[i, 'leaf_moisture_hours']
    data.loc[i, 'pathogen_growth'] = np.clip(
        (moisture / 24) ** 1.5 + np.random.normal(0, 0.1),
        0, 1
    )

    # Disease depends on pathogen growth
    pathogen = data.loc[i, 'pathogen_growth']
    data.loc[i, 'disease_present'] = 1 if pathogen > 0.6 else 0

    # Symptom severity depends on disease and plant vigor
    disease = data.loc[i, 'disease_present']
    vigor = data.loc[i, 'plant_vigor']
    data.loc[i, 'symptom_severity'] = np.clip(
        disease * (1 - vigor * 0.5) + np.random.normal(0, 0.1),
        0, 1
    )

print(data.head())
print(f"\nDisease prevalence: {data['disease_present'].mean():.2%}")
Create the causal model:
model = CausalModel(
    data=data,
    treatment='leaf_moisture_hours',
    outcome='symptom_severity',
    graph=causal_graph,
    common_causes=['environmental_stress', 'watering_practice'],
    effect_modifiers=['plant_vigor']
)

# Visualize the graph
model.view_model()

# Identify the causal effect
identified_estimand = model.identify_effect(proceed_when_unidentifiable=True)
print(identified_estimand)
What this code does:
Defines causal structure (the DAG)
Generates synthetic data following causal equations
Creates DoWhy model linking data to structure
Identifies causal effect of leaf moisture on symptoms
The structural equations:
# These are the causal mechanisms encoded in the data generation:

Leaf_Moisture = f(Environmental_Stress, Watering_Practice, noise)
Pathogen_Growth = g(Leaf_Moisture, noise)
Disease = h(Pathogen_Growth, noise)
Symptom_Severity = j(Disease, Plant_Vigor, noise)
Each function represents a causal mechanism. The DAG shows which variables go into which functions.
Querying the Model
Now we can ask causal questions:
# Estimate causal effect
estimate = model.estimate_effect(
    identified_estimand,
    method_name="backdoor.linear_regression"
)

print(f"Causal effect of leaf moisture on symptom severity: {estimate.value:.4f}")
print(f"95% Confidence Interval: [{estimate.get_confidence_intervals()[0]:.4f}, {estimate.get_confidence_intervals()[1]:.4f}]")
This tells us: For every additional hour of leaf moisture, symptom severity increases by X.
That's a causal claim, not correlation!
Example output:
Causal effect of leaf moisture on symptom severity: 0.0234
95% Confidence Interval: [0.0198, 0.0271]

Interpretation: Each additional hour of leaf moisture causes
a 2.34% increase in symptom severity (statistically significant).
We'll do much more with this in Part 3 (counterfactuals) and Part 4 (interventions).
Common DAG Patterns & Pitfalls
Causal Patterns You Need to Know
Understanding these patterns will help you build better DAGs.
Pattern 1: Confounding

Problem: Confounder causes both treatment and outcome, creating spurious association.
Example:
Season (C) → Watering frequency (T)
Season (C) → Disease prevalence (O)
You observe: More watering correlates with more disease.
Reality: It's because summer has both more watering AND more disease.
Solution: Control for confounders in analysis (we'll cover this in Part 4).
Pattern 2: Mediation

Definition: Mediator sits on the causal path between treatment and outcome.
Example in our DAG:
- Watering → Leaf Moisture → Pathogen Growth → Disease
Leaf Moisture and Pathogen Growth are mediators.
Why it matters:
Total effect: Watering → Disease (full causal path)
Direct effect: None (Watering doesn't cause Disease except through mediators)
Mediated effect: Watering → Moisture → Pathogen → Disease
Intervention implications:
You can intervene at any point in the chain
Earlier intervention (reduce watering) prevents the entire cascade
Later intervention (fungicide for pathogen) only stops downstream effects
Pattern 3: Collider Bias (The Trap)

Critical property: A and B are independent, but become correlated if you condition on C!
Example:
Disease (A) → Symptom Severity (C)
Plant Vigor (B) → Symptom Severity (C)
Symptom Severity is a collider.
The trap: If you only analyze plants with severe symptoms (conditioning on collider), you'll find:
Plants with low vigor tend to have disease
Plants with high vigor tend NOT to have disease
But this is spurious! You selected on the outcome.
In reality:
Disease and Plant Vigor are independent (no arrow between them)
They only appear related when you filter by severe symptoms
Real-world example:
Imagine you're studying what makes successful entrepreneurs. You only survey people who became billionaires (conditioning on outcome).
You find: High risk-taking OR exceptional luck leads to billions.
Among billionaires:
High risk-takers had average luck
Low risk-takers had exceptional luck
Spurious correlation! Risk-taking and luck appear negatively correlated, but only because you conditioned on success (the collider).
How to avoid: Don't condition on colliders unless you have a good reason.
Pattern 4: Selection Bias
Similar to collider bias, but about sample selection:

Example: You train your model only on:
Plants brought to clinic (Selection)
Which happens when: Disease is visible OR plant is expensive
Now disease and plant value appear correlated—but only because of selection!
Solution: Be aware of how your sample was selected.
DAG Validation Checklist
Before trusting your DAG:
[ ] Every arrow represents a direct causal effect
[ ] Missing arrows represent true independence
[ ] No feedback loops (check: acyclic?)
[ ] Domain experts reviewed the structure
[ ] Edge cases considered (extreme values)
[ ] Alternative DAGs ruled out
[ ] Testable implications identified
[ ] Data validates independence claims
Testing Your DAG
How to Know If Your DAG Is Right
A DAG makes testable predictions about independence relationships.
D-Separation: Reading Independence from Structure
Two variables are d-separated if all paths between them are blocked.
Example from our DAG:
Question: Are Environmental Stress and Plant Vigor independent?
Answer: Yes, they're independent (no path connects them).
Testable prediction: In our data, Environmental Stress and Plant Vigor should be uncorrelated.
If we find correlation, our DAG is wrong!
# Test independence
from scipy.stats import pearsonr

correlation, p_value = pearsonr(
    data['environmental_stress'],
    data['plant_vigor']
)

print(f"Correlation: {correlation:.4f}")
print(f"P-value: {p_value:.4f}")

if p_value > 0.05:
    print("✓ Independent (DAG validated)")
else:
    print("✗ Dependent (DAG may be wrong)")
Conditional Independence Tests
More complex: variables may be independent given others.
Example:
Are Watering Practice and Disease independent given Leaf Moisture?
Claim: Watering affects Disease ONLY through Moisture.
Test: Given Moisture, Watering and Disease should be independent.
In notation: Watering ⊥ Disease | Moisture
Python test:
from scipy.stats import chi2_contingency

# Group by leaf moisture levels
data['moisture_level'] = pd.cut(
    data['leaf_moisture_hours'],
    bins=3,
    labels=['low', 'med', 'high']
)

# Within each moisture level, test independence
print("Testing: Watering ⊥ Disease | Moisture\n")

for level in ['low', 'med', 'high']:
    subset = data[data['moisture_level'] == level]

    # Contingency table: watering vs disease
    table = pd.crosstab(
        subset['watering_practice'],
        subset['disease_present']
    )

    # Chi-square test
    chi2, p_value, dof, expected = chi2_contingency(table)

    print(f"Moisture {level}: p-value = {p_value:.4f}")
    if p_value > 0.05:
        print("  ✓ Independent (DAG validated)")
    else:
        print("  ✗ Dependent (DAG may be wrong)")
    print()
Expected output:
Testing: Watering ⊥ Disease | Moisture

Moisture low: p-value = 0.3421
  ✓ Independent (DAG validated)

Moisture med: p-value = 0.5634
  ✓ Independent (DAG validated)

Moisture high: p-value = 0.4523
  ✓ Independent (DAG validated)
If independence holds, our DAG structure is supported by data.
What If Tests Fail?
If your DAG fails independence tests:
1. Missing arrow: Add direct causal link
- Example: Watering → Disease (direct effect we missed)
2. Wrong direction: Reverse an arrow
- Example: Maybe Disease → Moisture (sick plants retain water?)
3. Missing confounder: Add common cause
- Example: Season → both Watering AND Disease
4. Wrong assumptions: Reconsider causal mechanism
- Example: Different disease types have different causal paths
Iterate: Build DAG → Test → Revise → Repeat
This is the scientific method applied to causal structure!
Advanced Validation: Falsification Tests
# DoWhy includes built-in refutation tests
from dowhy import CausalModel

# Refute by adding random common cause
refutation = model.refute_estimate(
    identified_estimand,
    estimate,
    method_name="random_common_cause"
)
print(refutation)

# Expected: Effect should remain stable
# If effect changes dramatically, DAG may be missing confounders
Practical Tips for DAG Construction
Start Simple, Iterate
Don't try to model everything at once:
Start with 3-5 key variables
Treatment of interest
Outcome of interest
1-3 confounders
Add complexity gradually
Mediators
Effect modifiers
Additional confounders
Test at each step
Validate new arrows
Check independence claims
Ensure model still makes sense
Use Domain Expertise
Best practices:
Interview domain experts: "What causes X?" "Does Y affect Z directly?"
Review literature: What causal mechanisms are established?
Start with consensus: Build on well-known relationships
Document assumptions: Write down why each arrow exists
Invite criticism: Ask skeptics "What am I missing?"
Common Mistakes to Avoid
1. Arrows everywhere
Don't connect everything
Missing arrows are meaningful (independence claims)
2. Correlation → Arrow
Just because X and Y correlate doesn't mean X → Y
Check for confounders first
3. Forgetting time
Causes must precede effects
Check temporal ordering
4. Ignoring mechanisms
Ask "HOW does X cause Y?"
If you can't explain it, maybe it's not causal
5. No validation
Always test your DAG
Data should support structure
Complete Working Example
Here's a complete, runnable script you can use as a template:
"""
Complete Causal DAG Implementation
Plant Disease Detection Example
"""

from dowhy import CausalModel
import pandas as pd
import numpy as np
import matplotlib.pyplot as plt
from scipy.stats import chi2_contingency, pearsonr

# Set random seed for reproducibility
np.random.seed(42)

# Define causal graph
causal_graph = """
digraph {
    Environmental_Stress [label="Environmental Stress"];
    Watering_Practice [label="Watering Practice"];
    Plant_Vigor [label="Plant Vigor"];
    Leaf_Moisture [label="Leaf Moisture"];
    Pathogen_Growth [label="Pathogen Growth"];
    Disease_Present [label="Disease Present"];
    Symptom_Severity [label="Symptom Severity"];

    Environmental_Stress -> Leaf_Moisture;
    Watering_Practice -> Leaf_Moisture;
    Leaf_Moisture -> Pathogen_Growth;
    Pathogen_Growth -> Disease_Present;
    Disease_Present -> Symptom_Severity;
    Plant_Vigor -> Symptom_Severity;
}
"""

def generate_causal_data(n_samples=1000):
    """Generate data following the causal DAG structure."""

    data = pd.DataFrame({
        'environmental_stress': np.random.beta(2, 5, n_samples),
        'watering_practice': np.random.choice([0, 1, 2], n_samples),
        'plant_vigor': np.random.beta(8, 2, n_samples),
        'leaf_moisture_hours': np.zeros(n_samples),
        'pathogen_growth': np.zeros(n_samples),
        'disease_present': np.zeros(n_samples),
        'symptom_severity': np.zeros(n_samples),
    })

    for i in range(n_samples):
        # Causal mechanism 1: Environmental Stress + Watering → Leaf Moisture
        base_moisture = 5.0
        stress_effect = data.loc[i, 'environmental_stress'] * 10
        watering_effect = [-3, 0, 5][data.loc[i, 'watering_practice']]

        data.loc[i, 'leaf_moisture_hours'] = np.clip(
            base_moisture + stress_effect + watering_effect + np.random.normal(0, 1),
            0, 24
        )

        # Causal mechanism 2: Leaf Moisture → Pathogen Growth
        moisture = data.loc[i, 'leaf_moisture_hours']
        data.loc[i, 'pathogen_growth'] = np.clip(
            (moisture / 24) ** 1.5 + np.random.normal(0, 0.1),
            0, 1
        )

        # Causal mechanism 3: Pathogen Growth → Disease
        pathogen = data.loc[i, 'pathogen_growth']
        data.loc[i, 'disease_present'] = 1 if pathogen > 0.6 else 0

        # Causal mechanism 4: Disease + Plant Vigor → Symptom Severity
        disease = data.loc[i, 'disease_present']
        vigor = data.loc[i, 'plant_vigor']
        data.loc[i, 'symptom_severity'] = np.clip(
            disease * (1 - vigor * 0.5) + np.random.normal(0, 0.1),
            0, 1
        )

    return data

def validate_dag(data):
    """Run validation tests on the DAG structure."""

    print("=" * 60)
    print("DAG VALIDATION TESTS")
    print("=" * 60)

    # Test 1: Environmental Stress ⊥ Plant Vigor
    print("\n1. Testing: Environmental_Stress ⊥ Plant_Vigor")
    corr, p_val = pearsonr(data['environmental_stress'], data['plant_vigor'])
    print(f"   Correlation: {corr:.4f}, P-value: {p_val:.4f}")
    if p_val > 0.05:
        print("   ✓ Independent (as expected)")
    else:
        print("   ✗ Dependent (DAG may be wrong!)")

    # Test 2: Watering ⊥ Disease | Leaf Moisture
    print("\n2. Testing: Watering ⊥ Disease | Leaf_Moisture")
    data['moisture_level'] = pd.cut(
        data['leaf_moisture_hours'],
        bins=3,
        labels=['low', 'med', 'high']
    )

    independence_holds = True
    for level in ['low', 'med', 'high']:
        subset = data[data['moisture_level'] == level]
        if len(subset) < 10:
            continue

        table = pd.crosstab(subset['watering_practice'], subset['disease_present'])
        chi2, p_val, dof, expected = chi2_contingency(table)

        print(f"   Moisture {level}: p-value = {p_val:.4f}", end="")
        if p_val > 0.05:
            print(" ✓")
        else:
            print(" ✗")
            independence_holds = False

    if independence_holds:
        print("   ✓ Conditional independence holds")
    else:
        print("   ✗ Conditional independence violated")

    print("\n" + "=" * 60)

def estimate_causal_effect(data, causal_graph):
    """Estimate causal effect using DoWhy."""

    print("\n" + "=" * 60)
    print("CAUSAL EFFECT ESTIMATION")
    print("=" * 60)

    # Create causal model
    model = CausalModel(
        data=data,
        treatment='leaf_moisture_hours',
        outcome='symptom_severity',
        graph=causal_graph,
        common_causes=['environmental_stress', 'watering_practice'],
        effect_modifiers=['plant_vigor']
    )

    # Identify causal effect
    identified_estimand = model.identify_effect(proceed_when_unidentifiable=True)
    print("\nIdentified Estimand:")
    print(identified_estimand)

    # Estimate effect
    estimate = model.estimate_effect(
        identified_estimand,
        method_name="backdoor.linear_regression"
    )

    print(f"\nCausal Effect: {estimate.value:.4f}")
    print(f"Interpretation: Each additional hour of leaf moisture")
    print(f"causes a {estimate.value:.4f} increase in symptom severity")

    # Refutation test
    print("\nRefutation Test (Random Common Cause):")
    refutation = model.refute_estimate(
        identified_estimand,
        estimate,
        method_name="random_common_cause"
    )
    print(refutation)

    return model, estimate

def main():
    """Run complete DAG analysis."""

    print("\n" + "=" * 60)
    print("BUILDING CAUSAL DAG: PLANT DISEASE DETECTION")
    print("=" * 60)

    # Generate data
    print("\nGenerating synthetic data (n=1000)...")
    data = generate_causal_data(n_samples=1000)

    print(f"\nData Summary:")
    print(f"Disease prevalence: {data['disease_present'].mean():.2%}")
    print(f"Mean symptom severity: {data['symptom_severity'].mean():.3f}")
    print(f"Mean leaf moisture: {data['leaf_moisture_hours'].mean():.2f} hours")

    # Validate DAG
    validate_dag(data)

    # Estimate causal effect
    model, estimate = estimate_causal_effect(data, causal_graph)

    print("\n" + "=" * 60)
    print("ANALYSIS COMPLETE")
    print("=" * 60)
    print("\nNext Steps:")
    print("1. Part 3: Use this DAG for counterfactual reasoning")
    print("2. Part 4: Design interventions based on causal effects")
    print("3. Part 5: Scale to production systems")

    return data, model, estimate

if __name__ == "__main__":
    data, model, estimate = main()
Save this as causal_dag.py and run:
python causal_dag.py
You've Built a Causal Model
Congratulations! You now have:
✅ A complete causal DAG for plant disease
✅ Understanding of confounders, mediators, colliders
✅ Working Python implementation with DoWhy
✅ Methods to validate your causal structure
✅ Template code you can adapt to any domain
This is the foundation. Everything we do next builds on this DAG.
What's Next: Counterfactual Reasoning
In Part 3 (Friday, Jan 16), we'll use this DAG to answer questions like:
"This plant has disease. Would it be healthy if I had watered less?"
"I applied intervention X. What would have happened without it?"
"Why did this specific plant get diseased when that one didn't?"
These are counterfactual questions—the most powerful form of causal reasoning.
We'll implement:
Counterfactual inference algorithms
"What if" scenario analysis
Personalized explanation generation
Individual treatment effect estimation
Your Homework Before Part 3
1. Run the code in this article
Generate the data
Build the DAG
Validate the structure
Estimate causal effects
2. Modify the DAG
Add a new variable (e.g., "Soil Quality")
Add corresponding arrows
Update the data generation
Test if it still validates
3. Apply to your domain
Think about a problem you're working on
Identify 5-7 key variables
Draw a DAG on paper
What causal questions would you want to answer?
4. Prepare questions
What's unclear about DAG construction?
What validation tests are you curious about?
What challenges do you foresee for your domain?
Bring these to Part 3. We're going deeper.
Series Navigation:
Part 2: Building Your First Causal DAG ← You are here
Part 3: Counterfactual Reasoning (Jan 16)
Part 4: Intervention Design (Jan 21)
Part 5: Distributed Systems (Jan 23)
Code & Resources:
This is part of my research at NeoForge Labs on causal AI systems. Follow along as we build production-grade causal reasoning from scratch.
Questions? Drop them in the comments below. I read and respond to everything.
Found this useful? Share it with someone who's struggling with production ML failures. Let's build better AI together.