
Part 1: Why Causality Matters for AI
Moving Beyond Correlation to True Understanding
Senior Software Engineer with a knack for Python, Golang, TypeScript, and Elixir. I am also a bit of a Rust enthusiast. I am excited by all things scalability and microservices. Join me on this journey to becoming a unicorn 10x Engineer.
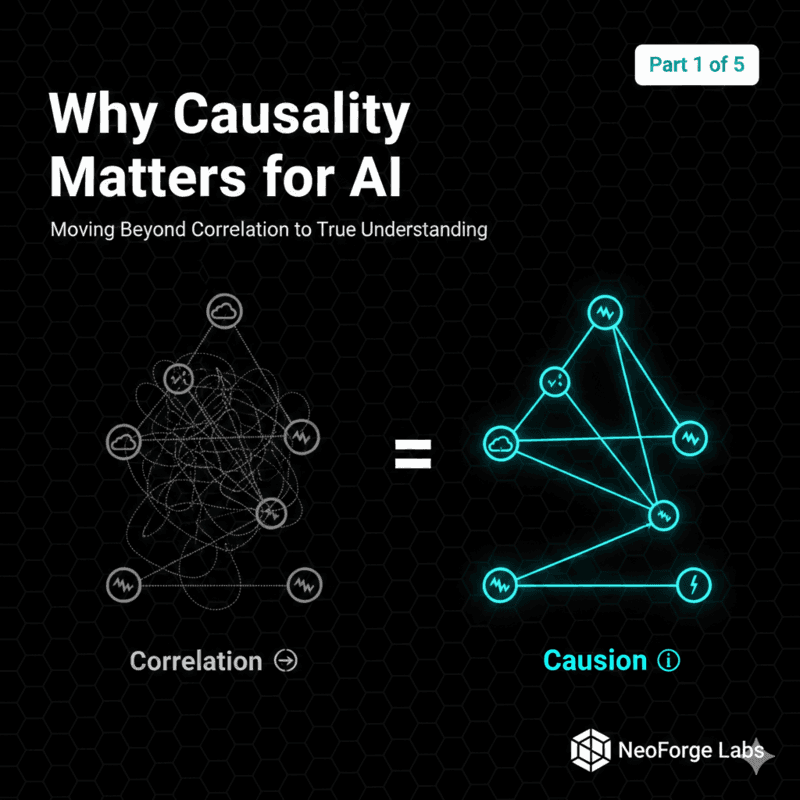
Your AI model achieves 95% accuracy predicting plant diseases from images. Impressive, right?
You deploy it to farmers. It works… until it doesn't. When farmers follow its recommendations, nothing happens. Sometimes, things get worse. The model saw patterns, learned correlations, but understood nothing about why diseases occur or what actually causes them. This is the correlation trap, and it's everywhere in modern AI.
Today, we're going to explore why the future of AI isn't just about bigger models or more data. It's about causality: understanding the mechanisms that generate our data, not just the patterns within it. By the end of the series, you'll build a causal reasoning system that doesn't just predict plant diseases, it explains why they occur and recommends interventions that actually work.
Let's start with the fundamental question: What's the difference between correlation and causation, and why should you care?
The Pattern Recognition Machine
Modern machine learning is fundamentally a pattern-matching engine. Given data about X and Y, it learns:
P(Y | X) - "What is the probability of Y given that we observe X?"
This works brilliantly for:
Image Classification: "Given these pixels, is this a cat?"
Recommendation systems: "Given this user's history, what will they like?"
Spam detection: "Given this email's features, is it spam?"
But here's the problem: observing X is not the same as changing X.
The Classic Trap: Ice Cream and Drowning
Imagine you're building a public safety AI. Your model discovers a strong correlation:
When ice cream sales go up, drowning deaths also go up.
Should you ban ice cream to prevent drowning?
Obviously not. The real causal structure is:
Hot weather increases ice cream sales
Hot weather increases number of people going swimming hence leading to more drowning deaths
In this case, hot weather is a confounder, it causes both variables. Ice cream sales and drowning deaths are correlated but not causally related. Your ML model sees the correlation but it has no idea about the mechanism.
Why This Breaks in Production
You might think, "Sure, but that's an obvious example. In practice, we'd catch that." Would you?
Consider our plant disease detector:
It learns: Yellowing leaves → Nitrogen deficiency
Correlation: 90% accuracy
But what it misses:
Overwatering → Root rot → Yellowing
Fungal infection → Yellowing
Natural senescence → Yellowing
The model sees "yellowing = nitrogen deficiency" because that's the most common pattern in the training data. But when you apply nitrogen fertilizer to an overwatered plant, you make the problem worse.
Correlation told you what's common. Causation tells you what actually works.
Pearl's Ladder: The Three Levels of Intelligence
Judea Pearl, the godfather of causal inference, describes three levels of causal reasoning:

Let's break these down with our plant disease example:
Level 1: Association (Seeing)
Question: "What symptoms are present?"
Notation: P(Symptoms | Disease)
ML Capability: ✅ Current AI excels here
Example:
Observation: Plant has brown spots and yellowing leaves
Model predicts: "85% probability of early blight"
This is correlation. The model sees patterns but doesn't understand the mechanisms.
Level 2: Intervention (Doing)
Question: "What happens if I change watering frequency?"
Notation: P(Disease | do(Watering = optimal))
ML Capability: ❌ Most AI fails here
The do() operator is crucial. It represents intervention, actively changing a variable, not just observing it.
Example:
Observational: P(Disease | Watering = high) might show correlation
Interventional: P(Disease | do(Watering = optimal)) shows causal effect
The difference:
Observation: Plants that are overwatered tend to be diseased (maybe because sick plants retain water?)
Intervention: If we reduce watering, does disease decrease? (causal effect)
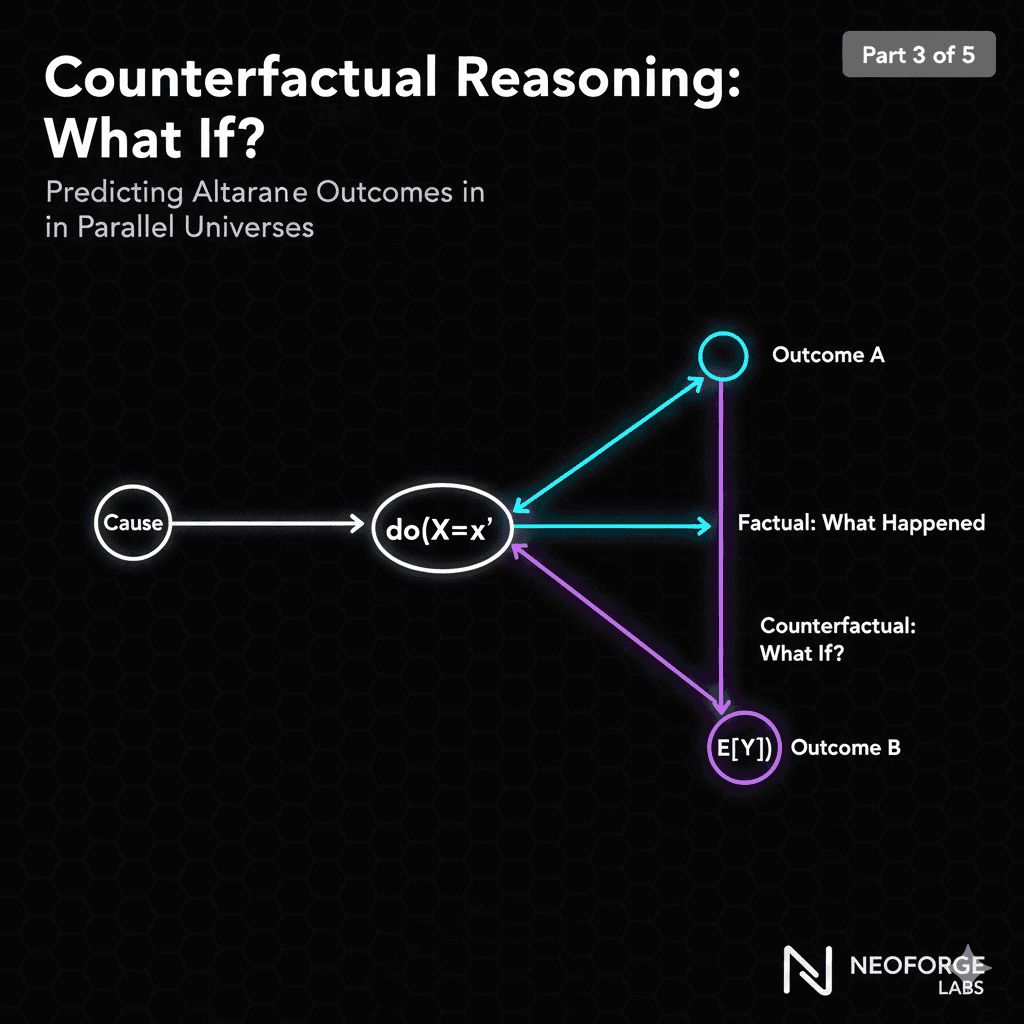
Level 3: Counterfactuals (Imagining)
Question: "Would this plant be healthy if I had watered it differently?"
Notation: P(Healthy | Watered differently, saw disease)
ML Capability: ❌❌ Almost no AI does this
This is the most powerful level. You're asking about alternate realities:
Example:
Factual: "I watered heavily, and the plant developed root rot"
Counterfactual: "If I had watered moderately, would the plant be healthy?"
This requires understanding:
The causal mechanism (overwatering → root rot)
The specific instance (this plant, these conditions)
Alternate histories (what would have been different)
Most AI systems operate at Level 1. Human experts operate at Levels 2 and 3. We're going to build AI that does the same.
The Problems with Pure Correlation
Let's be concrete about why correlation-based ML fails in practice:
Problem 1: Distribution Shift
Your model learns from data collected in:
Season: Summer
Location: Greenhouse A
Conditions: Controlled environment
You deploy to:
Season: Winter
Location: Outdoor farm
Conditions: Wild weather variation
What happens? All the correlations change. Your model has no idea what remains true (causal relationships) vs. what was just a coincidence (spurious correlation).
Problem 2: Spurious Correlations
Training data artifact: Most diseased plants in your dataset are near the south wall of the greenhouse. The model then learns to correlate south wall to disease.
Reality: South wall gets more light → higher temperature → more humidity → disease.
When you tell a farmer, "move your plants away from south-facing walls," you've given useless advice based on spurious correlation.
With causal knowledge: You'd recommend humidity control, which actually addresses the mechanism.
Problem 3: No Intervention Guidance
Even when your model correctly identifies disease, it can't answer:
What should I do about it?
Which intervention will be most effective?
What's the root cause I should address?
It can only tell you: "This looks like early blight" (association).
It cannot tell you: "Reduce watering and improve air circulation" (intervention).
What We Need Instead
A causal model that:
Explains mechanisms: Why does disease occur?
Predicts interventions: What happens if I change X?
Handles distribution shift: Which relationships are stable across contexts?
Enables counterfactual reasoning: What would have happened if…?
This is what we're building in this series.
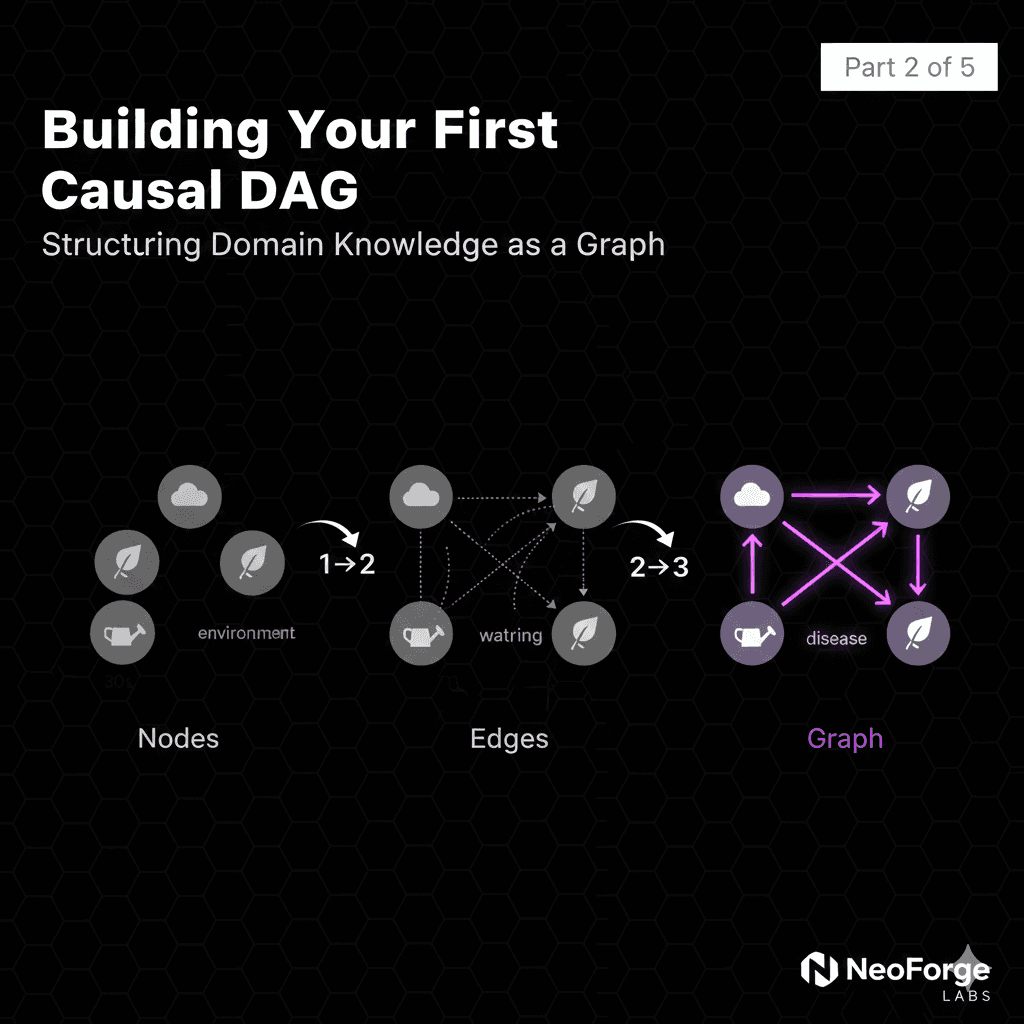
A Different Approach: Causal Graphs
Instead of learning correlations from data, we explicitly model causal relationships:

This Directed Acyclic Graph (DAG) represents our causal understanding:
Arrows show causation, not just correlation
No arrow means no direct causal effect
Structure encodes domain knowledge
With this graph, we can answer intervention questions:
Q: "What happens if I reduce watering?"
A: Follow the causal path: Watering ↓ → Moisture ↓ → Pathogen Growth ↓ → Disease ↓
This is fundamentally different from correlation. We're modeling the data-generating process, not just patterns in data.
The Power of do()
The do() operator represents intervention:
P(Disease | Watering = high): Observation (what we see)
P(Disease | do(Watering = low)): Intervention (what would happen if we change it)
These are different!
Observation includes confounders. Maybe plants that are naturally disease-prone are also overwatered by worried farmers.
Intervention breaks the confounding. We're asking: independent of everything else, what's the causal effect?
What's Coming in This Series
Over the next 5 articles, you'll learn to:
Part 2: Build causal DAGs from domain knowledge
Part 3: Use counterfactual reasoning to predict alternate outcomes
Part 4: Design interventions based on causal effects
Part 5: Scale causal inference to production systems
By the end, you'll have built a complete causal diagnostic system for plant diseases, and you'll understand how to apply these principles to any domain.
Case Study: The Yellowing Leaves Mystery
Let's make this concrete with a real diagnostic scenario.
The Correlation Approach
Farmer brings you a plant with yellowing leaves.
Your ML model:
Analyzes image
Matches pattern to training data
Outputs: "80% probability: Nitrogen deficiency"
Recommendation: Apply nitrogen fertilizer
What Actually Happens
Farmer applies nitrogen. Plant gets worse.
Why? The actual cause was overwatering leading to root rot. Adding nitrogen to an already-sick plant stressed it further.
The Causal Approach
Instead of just pattern matching, we reason causally:

Causal diagnostic process:
Identify possible causes (multiple hypotheses)
Check diagnostic indicators for each cause
Find root cause via causal mechanism
Recommend intervention targeting the actual cause
Results:
Soil moisture: Very high ✓
Soil nitrogen: Normal levels
Leaf spots: None
Affected leaves: Throughout plant
Diagnosis: Overwatering → Root rot → Nutrient uptake impaired → Yellowing
Intervention: Reduce watering, improve drainage, let soil dry
Outcome: Plant recovers
The Difference
| Correlation ML | Causal Reasoning |
| Pattern matching | Mechanism understanding |
| Single prediction | Multiple hypotheses |
| No "why" | Explains root cause |
| Generic recommendation | Targeted intervention |
| Fails on edge cases | Handles novel scenarios |
This is why causality matters.
Where We're Headed
You've now seen why correlation isn't enough. Pattern matching fails when:
Distributions shift
Interventions are needed
You need to explain "why"
In Part 2, we'll get hands-on. You'll learn to:
Build your first causal DAG
Encode domain knowledge as a graph structure
Identify confounders, mediators, and colliders
Validate your causal assumptions
We'll continue with our plant disease example, constructing the complete causal graph that maps environmental factors → physiological responses → observable symptoms.
By the end of Part 2, you'll have a working causal model, the foundation for everything that comes after.
Your Challenge
Before Part 2, think about a problem in your domain:
What patterns do your ML models learn?
What's the actual causal mechanism?
Where have you seen correlation fail?
Bring these questions to Part 2. We're going to build something better.
Series Navigation:
Part 1: Why Causality Matters ← You are here
Part 3: Counterfactual Reasoning (Jan 17)
Part 4: Intervention Design (Jan 22)
Part 5: Distributed Systems (Jan 24)
This is part of my research at NeoForge Labs on causal AI systems. Follow along as we build production-grade causal reasoning from scratch.
Questions? Drop them in the comments below.